Excerpts: codex metrics, results in controlled environments

M. Everett Lawson

Control Series

Recognition accuracy

Correct symbol (high-confidence) confirmation was recorded via button press within the window of stimulus presentation coupled with accurate symbol ID reporting on the provided sheet (in addition to recorded verbal response) and weighed against gaze threshold limitations.  Instances of absent or late detection button presses or inaccurate symbol ID reporting were logged as incorrect.  In the control series, conducted in a standard psychophysical environment, accuracy rates were consistently high, with little variance across subjects

Recognition speed

Time of detection of each symbol is indicated by dots, color coded to each subject (see key in upper right hand quadrant). Solid lines indicate fitted curves (see summary in table below).

The amount of time required to make an accurate discrimination is also a critical metric in assessing practicality and feasibility. There are two significant outcomes from these results. 

First, the graph above shows that the majority of subjects demonstrated a significant improvement in detection times over successive trials.

Second, improvements in detection speeds across subjects appear to reach a floor around 1500 ms.  This is likely a feature of design characteristics of the codex blocks themselves. Symbol stroke speeds determine how long it took an observer to confidently discriminate one symbol from another. Codex block stroke speed limited how quickly similar symbols (such as *3* and *2*) could be differentiated.  True lower limits of accurate detection times could be weighed in future studies by increasing symbol stroke speeds until a falloff in detection accuracy occurs. 

The table below summarizes the fitted trends in detection times for each subject.

codex block metrics

The mean detection time for each symbol (in red) was recorded and is shown here trending over successive trials.  The shaded area represents the span of responses and encompases the mean: plus or minus one standard deviation.

Comparing *STICKFIGURE* and *C* is a key example of how symbol complexity impacts speed of recognition.

However, symbols *C* and *D* do not differ greatly in their base complexity, yet they were shown to have very different outcomes.  It is essential to objectively quantify the codex blocks to better understand this variability.

Motion energy analysis (MEA)

To accomplish this, motion energy was calculated for each codex, based on a multi-stage analysis described by Lu and Sperling.  First, each codex block was decomposed into projections on the x-t and y-t planes.  In the analysis implemented here, the projections from each aperture were superimposed into a single image.  Combining projections like this allows us to evaluate total motion energy from all apertures over the course of the entire codex block duration. On-off timing of each aperture is clearly evident in the x-t and y-t projections by repeated rows of pixels, indicating the absence of motion. 

Fourier power spectra were computed for each projection to isolate harmonics.  The motion energy is then given by summing the contributions of each quadrant of the power spectrum.

Motion energies of each projection, i.e. Ex (x-projection motion energy) and Ey (y-projection motion energy), form components of a vector in space whose magnitude yields absolute motion energy .

Codex MEA Summary

We can see that motion energy distributes codex blocks as expected – more complex symbols comprised of more apertures and longer duration exhibit higher motion energy.  More importantly, this analysis also captures some of the subtler, less obvious manifestations of codex block design.  The symbol *TREE* exemplifies this well (see below).

This codex block displays two synchronous, symmetric strokes, each forming either side of the tree symbol, (see graph (B) on the right).  Each aperture contains a different white Gaussian noise source.  If it were designed with identical images behind each aperture (such as the same white Gaussian noise image mirrored about its vertical axis), motion energy analysis along the x-projection would sum to zero. 

In this case, grain variations generate resultant motion artifacts which skew the x energy component to minus 2.31, indicating presence of resultant motion from right to left. 

For comparison, other codex blocks composed of single apertures and approximately neutral motion in x-projection,  such as *3* and *C*, exhibit Ex values at or near zero.

This is important because it shows a significant variance in grain distribution and future work will need to closely evaluate randomized grain sources for resultant motion artifacts.

Codex motion energy versus detection speed

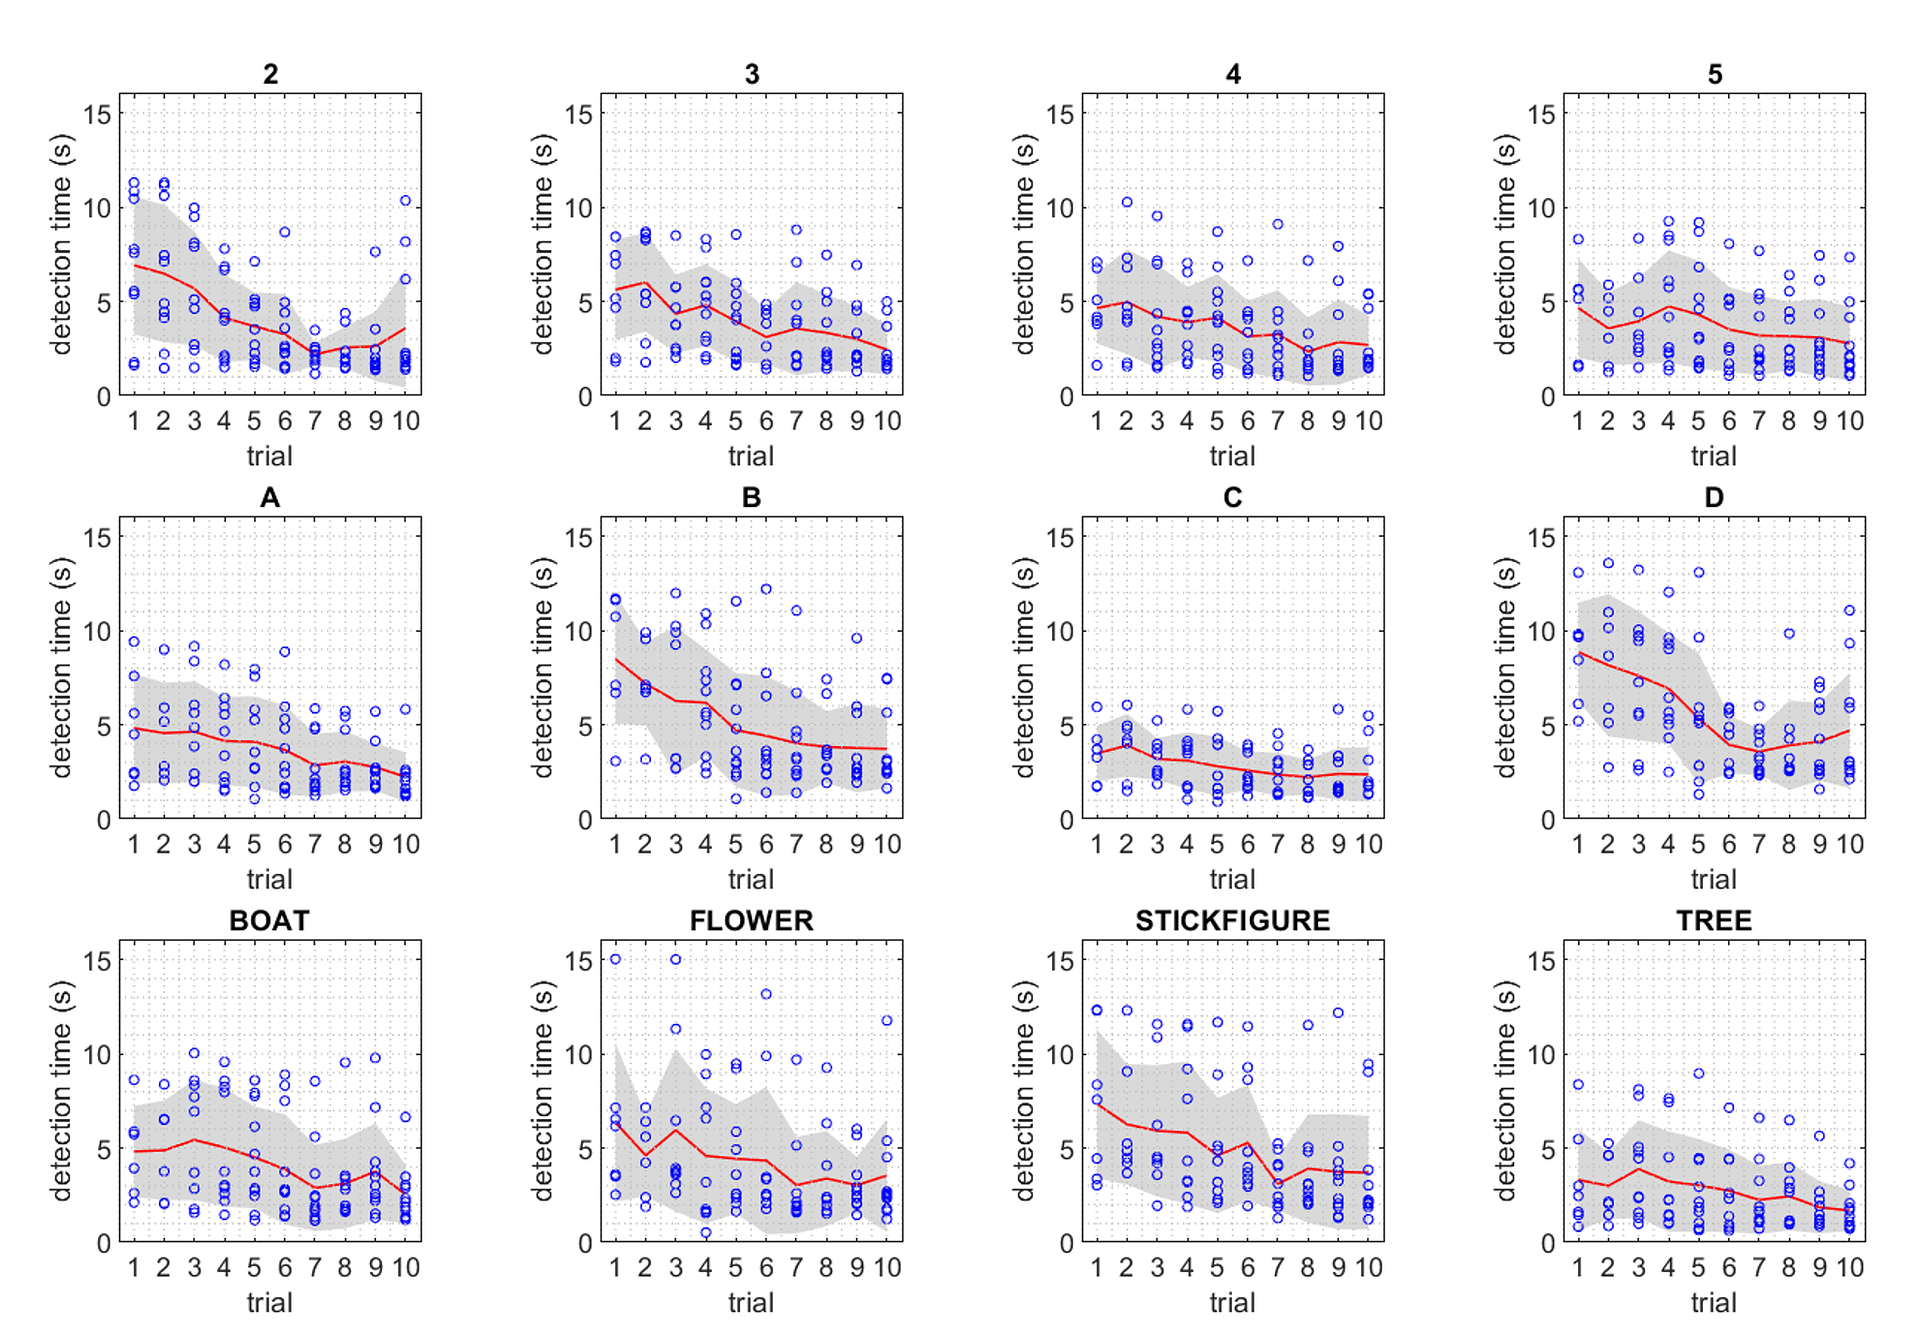
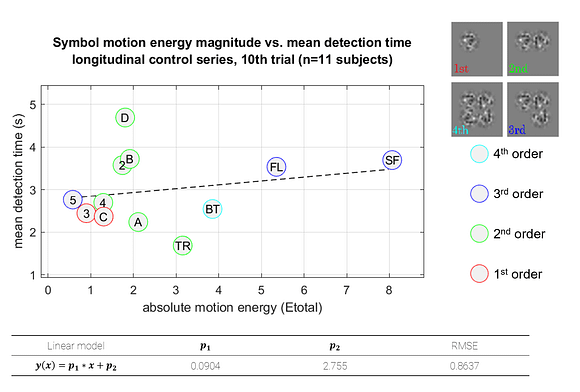
This representation shows the performance of each symbol in detection speed across the control environment versus absolute motion energy.  A linear trend is fit to approximate the relationship between absolute motion energy and steady-state detection rate (calculated from the final trial in the control series, n=11).   Absolute motion energies of higher complexity symbols such as *stick figure* and *boat* were greater than simpler geometries such as *4* or *C* which is consistent with the expectation that symbols of higher-order (more apertures) and longer duration convey more motion energy.    What’s interesting in this representation is a noticeable cluster of recognition times (in seconds) across the majority of symbols presented in the control series.  In terms of spatial differentiation of time over motion energy, two significant outliers deviate from the approximate trend.  A representation of absolute motion energy versus detection time is shown below, with symbols demarcated by their order (1st through 4th order, indicating the number of apertures present in the codex block).

Notable outliers above, *D* and *TR* (shorthand for *tree*), while both 2nd order symbols, fall on either side of the trend. Improvement in detection rates observed for *TR* is best explained by it’s uniqueness in the codex – *TR* was the only symbol to present motion stimulus in multiple apertures simultaneously.  Improvements in detection times over repeated trials could be attributed to many factors.  One of the most significant is the ability to discriminate symbols in the context of a known subset.  In this respect, the uniqueness of *TR* contributed significantly to its low mean detection times.

Uniqueness also played a critical role in the outcomes for symbols *D* and *B*. While having comparatively low motion energies, these required the most time for accurate detection.  In terms of stroke trajectories, *D* and *B* are functionally identical for the first half of the symbol presentation.  This lack of uniqueness imposes a limit on improvements in detection rates for these symbols.  Furthermore, we know from prior work in parameterizing MIPS stimuli, tangential motion, such as the vertical downstroke of *B* and *D* symbols, is far less pronounced than horizontal strokes moving toward or away from the fovea [26], and could have also impacted the perceptibility of these codex blocks.

Uniqueness as a determinant of detection rate does not account for the discrepancy between *B* and *D*, however; to account for this, we must consider the impact of features within white Gaussian noise grain.  When grain moves behind an aperture along the stroke path, patterns and features in the grain can create small apparent motion effects.  In the case of *D*, an anomaly in the grain causes the downward stroke to appear wavy.  These small motion effects were sufficient to cause confusion in the first half-second of symbol perception, greatly limiting improvements in detection time for *D*.  For future codex development, one possible approach to identifying unwanted motion effects from grain anomalies could include comparing the desired motion with optical flow measurements.

The role of confusion (i.e. false positives), while not formally evaluated in these experiments, is a critical consideration in the design of a visual language.  Within the results of the experimentation described here, there were several recorded instances of false-positive symbol detection between the characters *B* and *D*, but not between any other codex blocks.  While there are other instances of similar stroke geometries, such as *3* and *2*, these blocks were distinct in other easily perceptible ways (i.e. number of apertures or codex block duration).  Only symbols *B* and *D* were similar across stroke geometry, number of apertures, and codex block duration.  In future studies to refine and improve the codex, a key component of optimization will be the design of a library to maximize uniqueness across these three parameters.

Ultimately, the majority of symbols fall within a time frame for complex semantic information delivery that may have a significant impact in industry, both in aerospace and aeronautical instrumentation design, but illustrate a positive trend in the development of generating new stroke geometries to further refine a broader development of codices. 

© 2020 M. Everett Lawson.